Thinking in Public: The Gender Polyconflict, Part 3


There's a famous quote of Martin Luther King Jr, which reads:
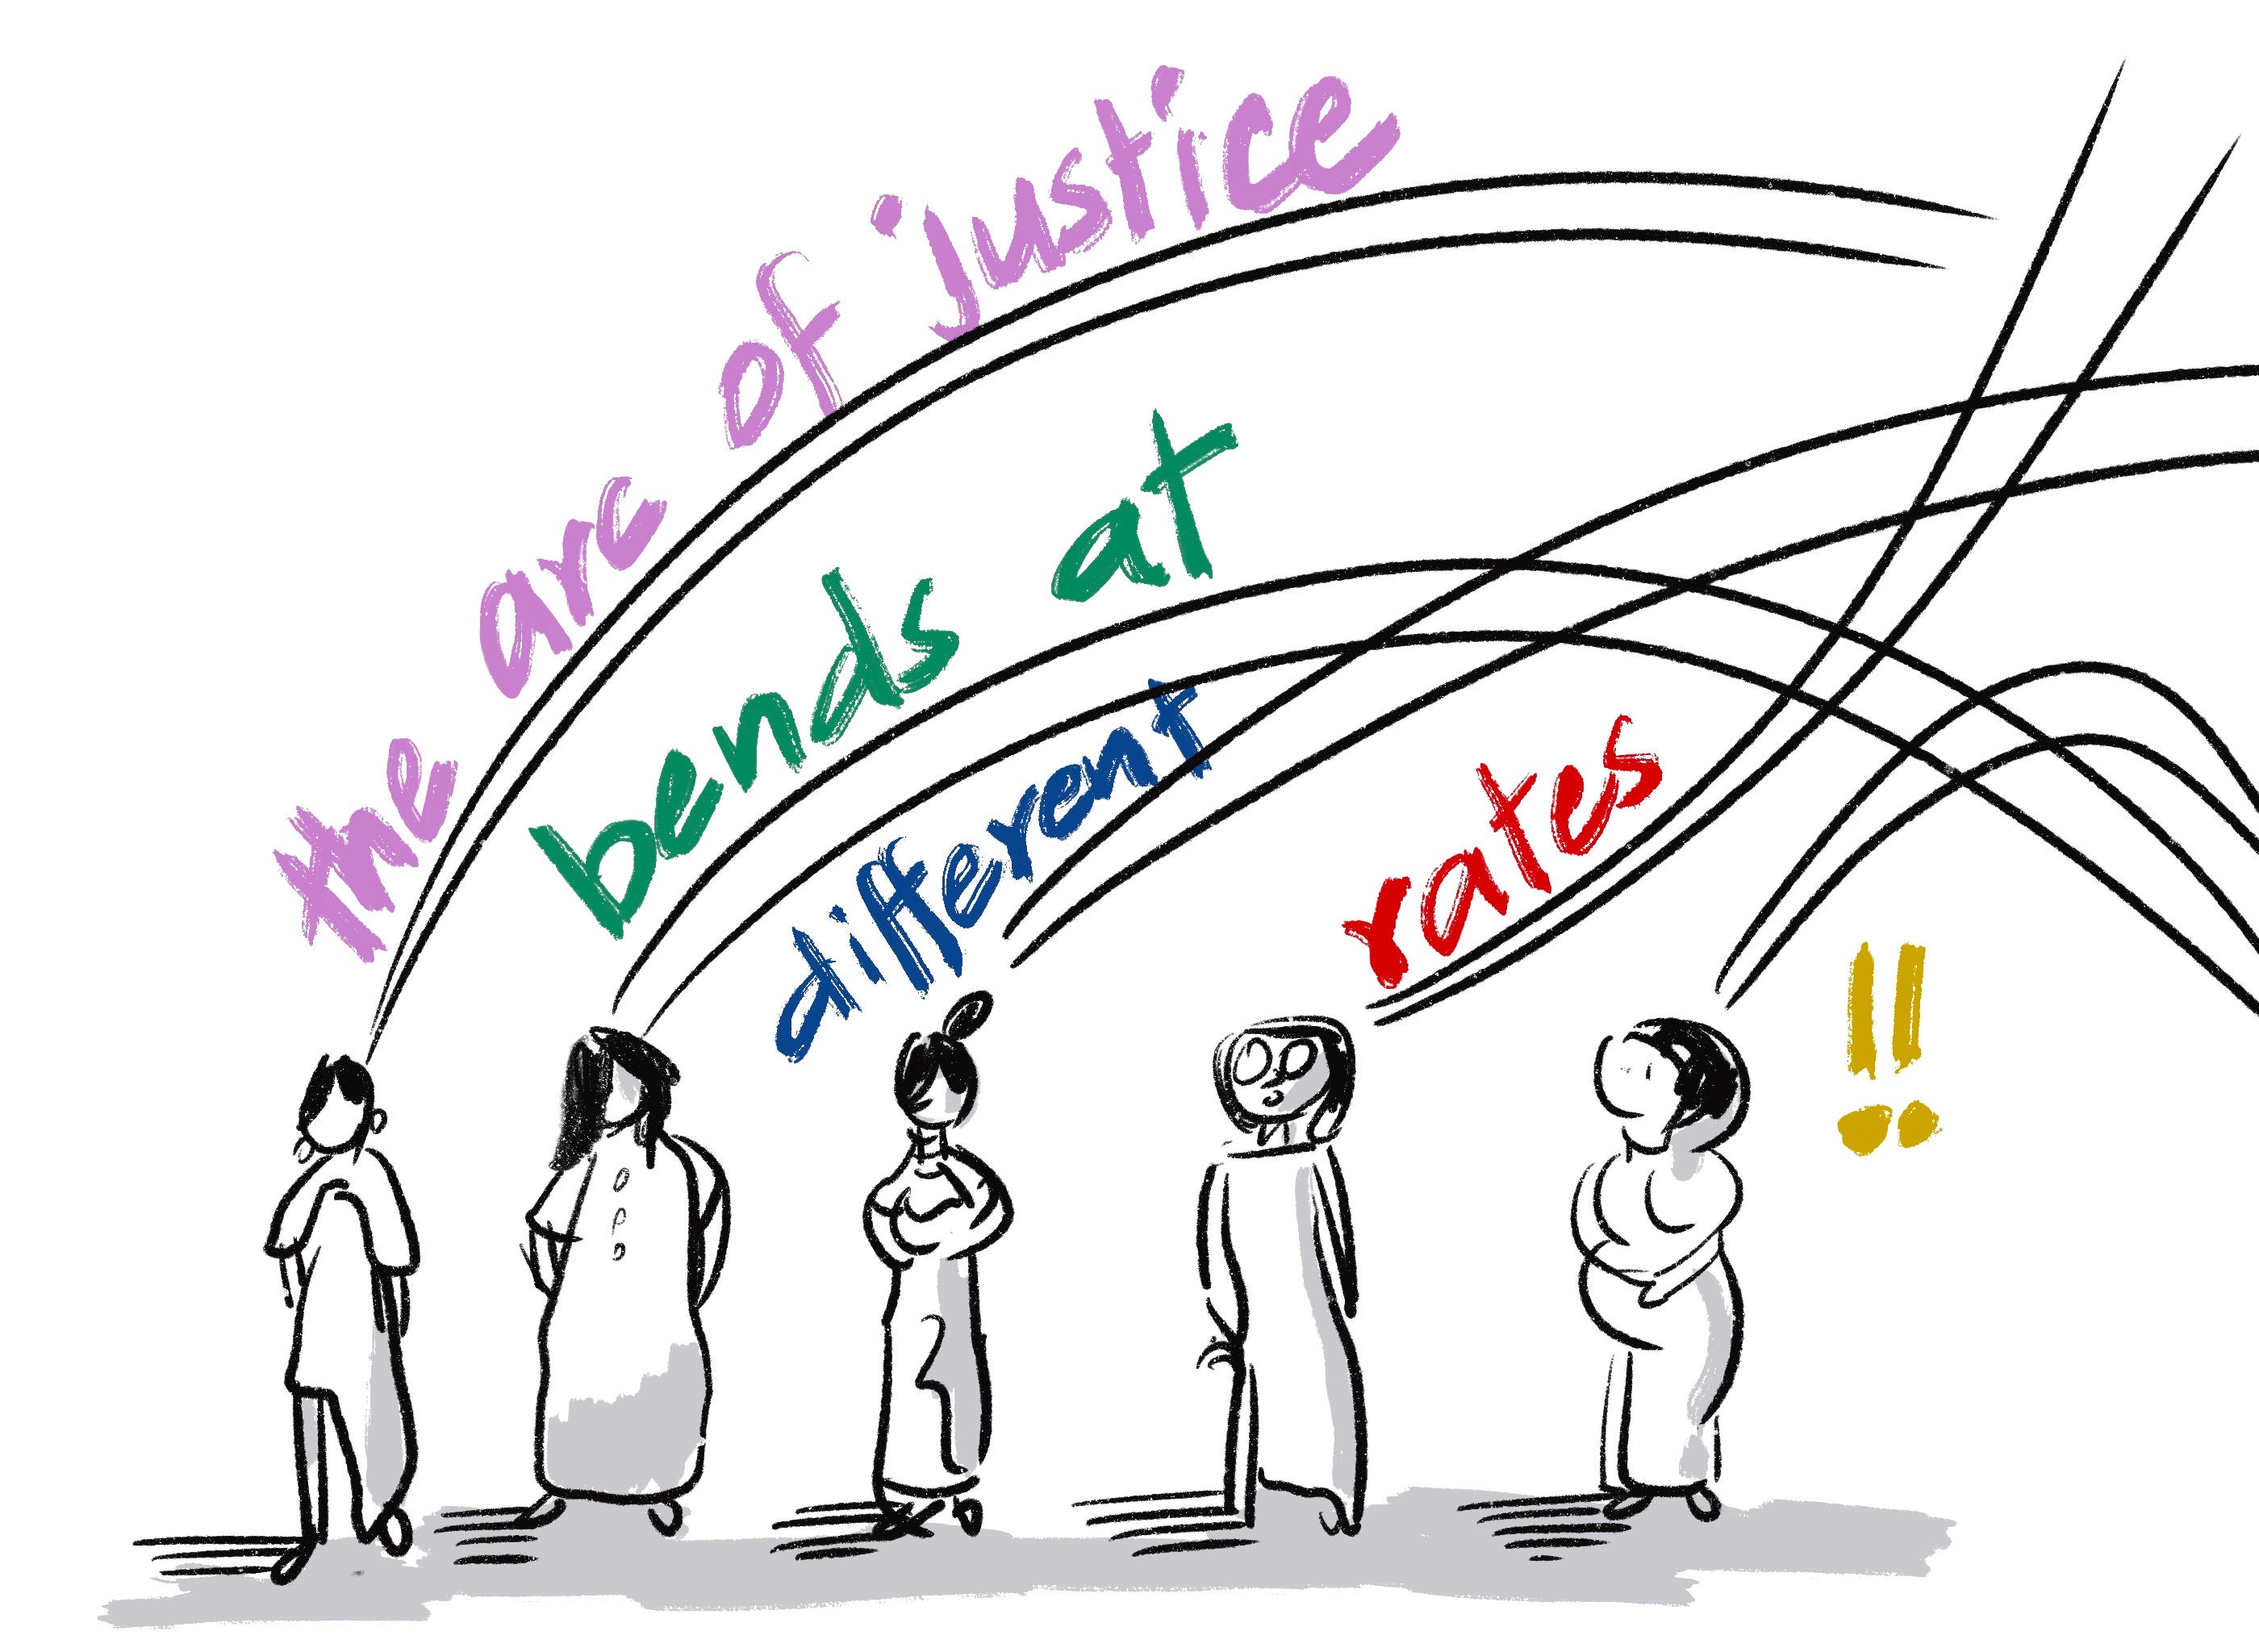
The Arc of the Moral Universe is Long, But it Bends Toward Justice.
To which we might add:
There are many arcs, and they bend towards justice at different rates.
Over the last two decades, we have seen massive drop offs in fertility rates, to the point that governments are now concerned about increasing birth rates rather than lowering them. We have also seen a large increase in the number of educated women at every level of the education system. In many first world countries, there are more women in college than men, which is one of the driving factors of the political divide between men and women - college educated voters choose differently than voters who have a high-school education and no more.
Not only in the first world; somewhat surprisingly, Iran has more women going to college than men. India lags behind Iran in this respect - and perhaps many others - but there's been a distinct uptick in women's literacy in India. However, that uptick hasn't translated into women joining the workforce, which we covered last week and will be building upon in this week's essay.
Data Dreams and Nightmares
In our previous issue, we zeroed in on one aspect of the conflict for economic freedom – employment for women – and noted that at 31%, the female workforce participation rate in India stood in the bottom decile of countries in the world. For those of us with no more political power than any ordinary citizen, our case for policy change must necessarily be backed by evidence. Beyond necessity, evidence-backed change promotes accountability and enables continuous improvement. If evidence-based change succeeds, we will know who and what to credit; if it fails, we will know how to trace back to exactly what failed; and thus, we can efficiently allocate resources towards whatever delivers outcomes.
The dream situation for anyone making a case for change is, therefore, one with abundant, high quality data. Scouring the internet for relevant data for our case, we found ourselves in much more of a nightmare than a dream. Just one reasonable design choice – to look for state-level data that are all structured similarly – left us with the singular choice of data source: the Census of India. The most recently published census is the one conducted 14 years ago, in 2011.
Even as we made tough peace with the latency, we had to contend with the difficulties of obtaining data, whether from the ambitious but badly catalogued data.gov.in or by scraping off the Census of India website. Navigating that nightmare, nevertheless, we found ourselves looking at the shape of the problem of female workforce participation in India, in 2011, which, barring the pandemic year of 2020, saw amongst the lowest female workforce participation in three and a half decades.
Gendered Landscapes of Life, Employment and Power
Uneven Beginnings: The Gendered Landscape of Life
While India waged wars against female infanticide and sex-selective abortion, with support from the various union and state governments, the national Sex Ratio of India in 2011, for ages 15-59 stood at 1.06, reflecting 106 male lives for every 100 female lives. For context, World Bank data on sex ratio places India at the bottom 5% of all countries, but as with most things Indian, the sex ratio landscape is hardly uniform. On the one end of the spectrum stood Kerala, Tamil Nadu and Manipur, with 90-99 males for every 100 females, and on the other, stood Chandigarh, Delhi, Sikkim, Haryana and Jammu & Kashmir, with 112-125 males for every 100 females. Despite all the progress we have made on this front, these numbers continue to sketch in stark lines the gendered contours of life itself: of who is born, who survives, and gets counted.
Incidentally, Sikkim is an outlier for reasons other than sex selective abortion or infanticide - the imbalance comes from high death rates for women in the middle of their lives.
Employment: Where the Gaps Deepen
If those were imbalances etched into existence itself, the terrain of employment reveals an even deeper gendered fault line. In 2011, among individuals aged 15-59, a staggering 245 men were employed for every 100 women in India. Yet again, the picture is far from uniform: the sex ratio among workers ranged from 1.3 (130 male workers per 100 female workers) in the northeastern state of Manipur to a stark 5.78 (578 male workers per 100 female workers) in the national capital of Delhi.
One pattern, however, holds across all states: the gender gap in employment exceeds the gap in the general population. We define “Sex Disparity” as the amount by which sex ratio within a group (such as workers) exceeds that in the general population. The data and visualisations of these statistics reinforce the hypothesis we outlined last week: while steady state-led efforts have improved the sex ratio in the general population, the lack of equivalent investment in women's workforce participation is glaringly visible in India’s employment landscape.
Rethinking Assumptions with Data
A common cultural narrative is that women are destined to be mothers, rather than wage earners. Yet there are some revealing patterns in the data, if you look closely enough. Both Punjab and Tamil Nadu report low Total Fertility Rates (TFR): 1.6 for Punjab and 1.8 for Tamil Nadu. Female literacy rates are also comparable, hovering around 78% in 2022. Yet, outcomes diverge sharply when it comes to gender equity in employment. Punjab fares poorly on sex ratio in the general population and has the second highest workforce disparities in the country, of 3.35 points. In contrast, Tamil Nadu’s workforce sex disparity is under 1 point, suggesting more sex-balanced participation. This contrast might be partly explained by the nature of agricultural labour in Punjab, which relies heavily on male migrant workers from other states. But this remains a hypothesis until the data is examined more closely.
In any case, as we said, the arc of justice bends at different rates.
Power Structures and Political Access
The landscapes of life and employment already reveal deep asymmetries, the terrain of power - who decides, who represents, and who speaks - is shaped by even starker exclusions. According to PRS Legislative Research, Women constituted approximately 15% of the Lok Sabha, 13% of the Rajya Sabha and between 0 and 18% of state legislative assemblies as late as 2019. Even in panchayats, where constitutional amendments mandate one-third reservation for women, their actual influence often remains limited due to entrenched patriarchy and informal power structures. But meaningful participation is not out of reach—it can be strengthened through better implementation of quotas, support for women leaders at all levels, and institutional safeguards that ensure women’s voices are heard and acted upon.
Intersectional Contradictions: Rurality, Caste, and Gender
The assumption that urban and upper-caste populations are more progressive in gender outcomes does not hold up to scrutiny. As the figure shows, gender equity, as measured both by the sex ratio in the general population and among employed individuals, is consistently higher among SC-ST and rural groups, at the national level. Among general caste urban populations, the male-to-female sex ratio in the population was skewed at 108 males per 100 females aged 15-59 in 2011. This imbalance, however, became massively amplified in the workforce, rising to 403 male workers per 100 female workers aged 15-59. In contrast, rural SC-ST populations show a much more near-parity sex ratio in the population (104 males per 100 females) and a far lower workforce disparity (150 male workers per 100 female workers), suggesting both survival and participation are more equitably distributed in rural SC-ST communities.

(Source: The Census of India)
These figures contradict narratives that associate urbanity and caste privilege with gender progress. Yet the explanation, at least insofar as the gender gap in the employment landscape is considered, may lie elsewhere, in, for example, economic status. General caste urban households may have more resources and thus less economic pressure for women to work, while rural SC-ST families may rely on every adult earner. In this view, which, for us, remains to be corroborated by data, higher female employment in disadvantaged groups may reflect necessity more than empowerment. Furthermore, here, too, we must consider state-level diversity in the statistics and causal factors specific to localities.
Even so, driven by necessity or not, higher female participation in work signals a form of gender equity that cannot be ignored. And let’s not forget to wonder why it is that urban, caste privileged communities had lower sex ratios in general! Gender equity, it turns out, is not always where we presume it to be.
Conclusion
The data reveals that India's gender landscape is far from uniform, with stark regional variations in sex ratios mirroring deeper institutional and cultural divides. While some states like Kerala and Tamil Nadu demonstrate more balanced gender demographics, others struggle with severe imbalances that reflect entrenched structural inequities. This regional variation echoes the broader theme of our series: gender conflicts manifest differently across contexts but consistently reveal power dynamics at multiple scales.
The challenges in accessing and analyzing gender-related data in India – from outdated census figures to poorly organized government databases – mirror the institutional barriers to gender equity discussed in our previous essays. This data scarcity isn't merely a technical problem; it represents a structural obstacle to evidence-based policy-making and accountability. As we've seen across all three parts of this series, whether examining electoral patterns, fertility transitions, or workforce participation, the ability to measure and understand gender dynamics is crucial for addressing systemic inequities.
While we have restricted ourselves to a national analysis in this essay, we will zoom into a scale below that in the next one, which will focus on a within-state comparison of Tamil Nadu across its various districts.