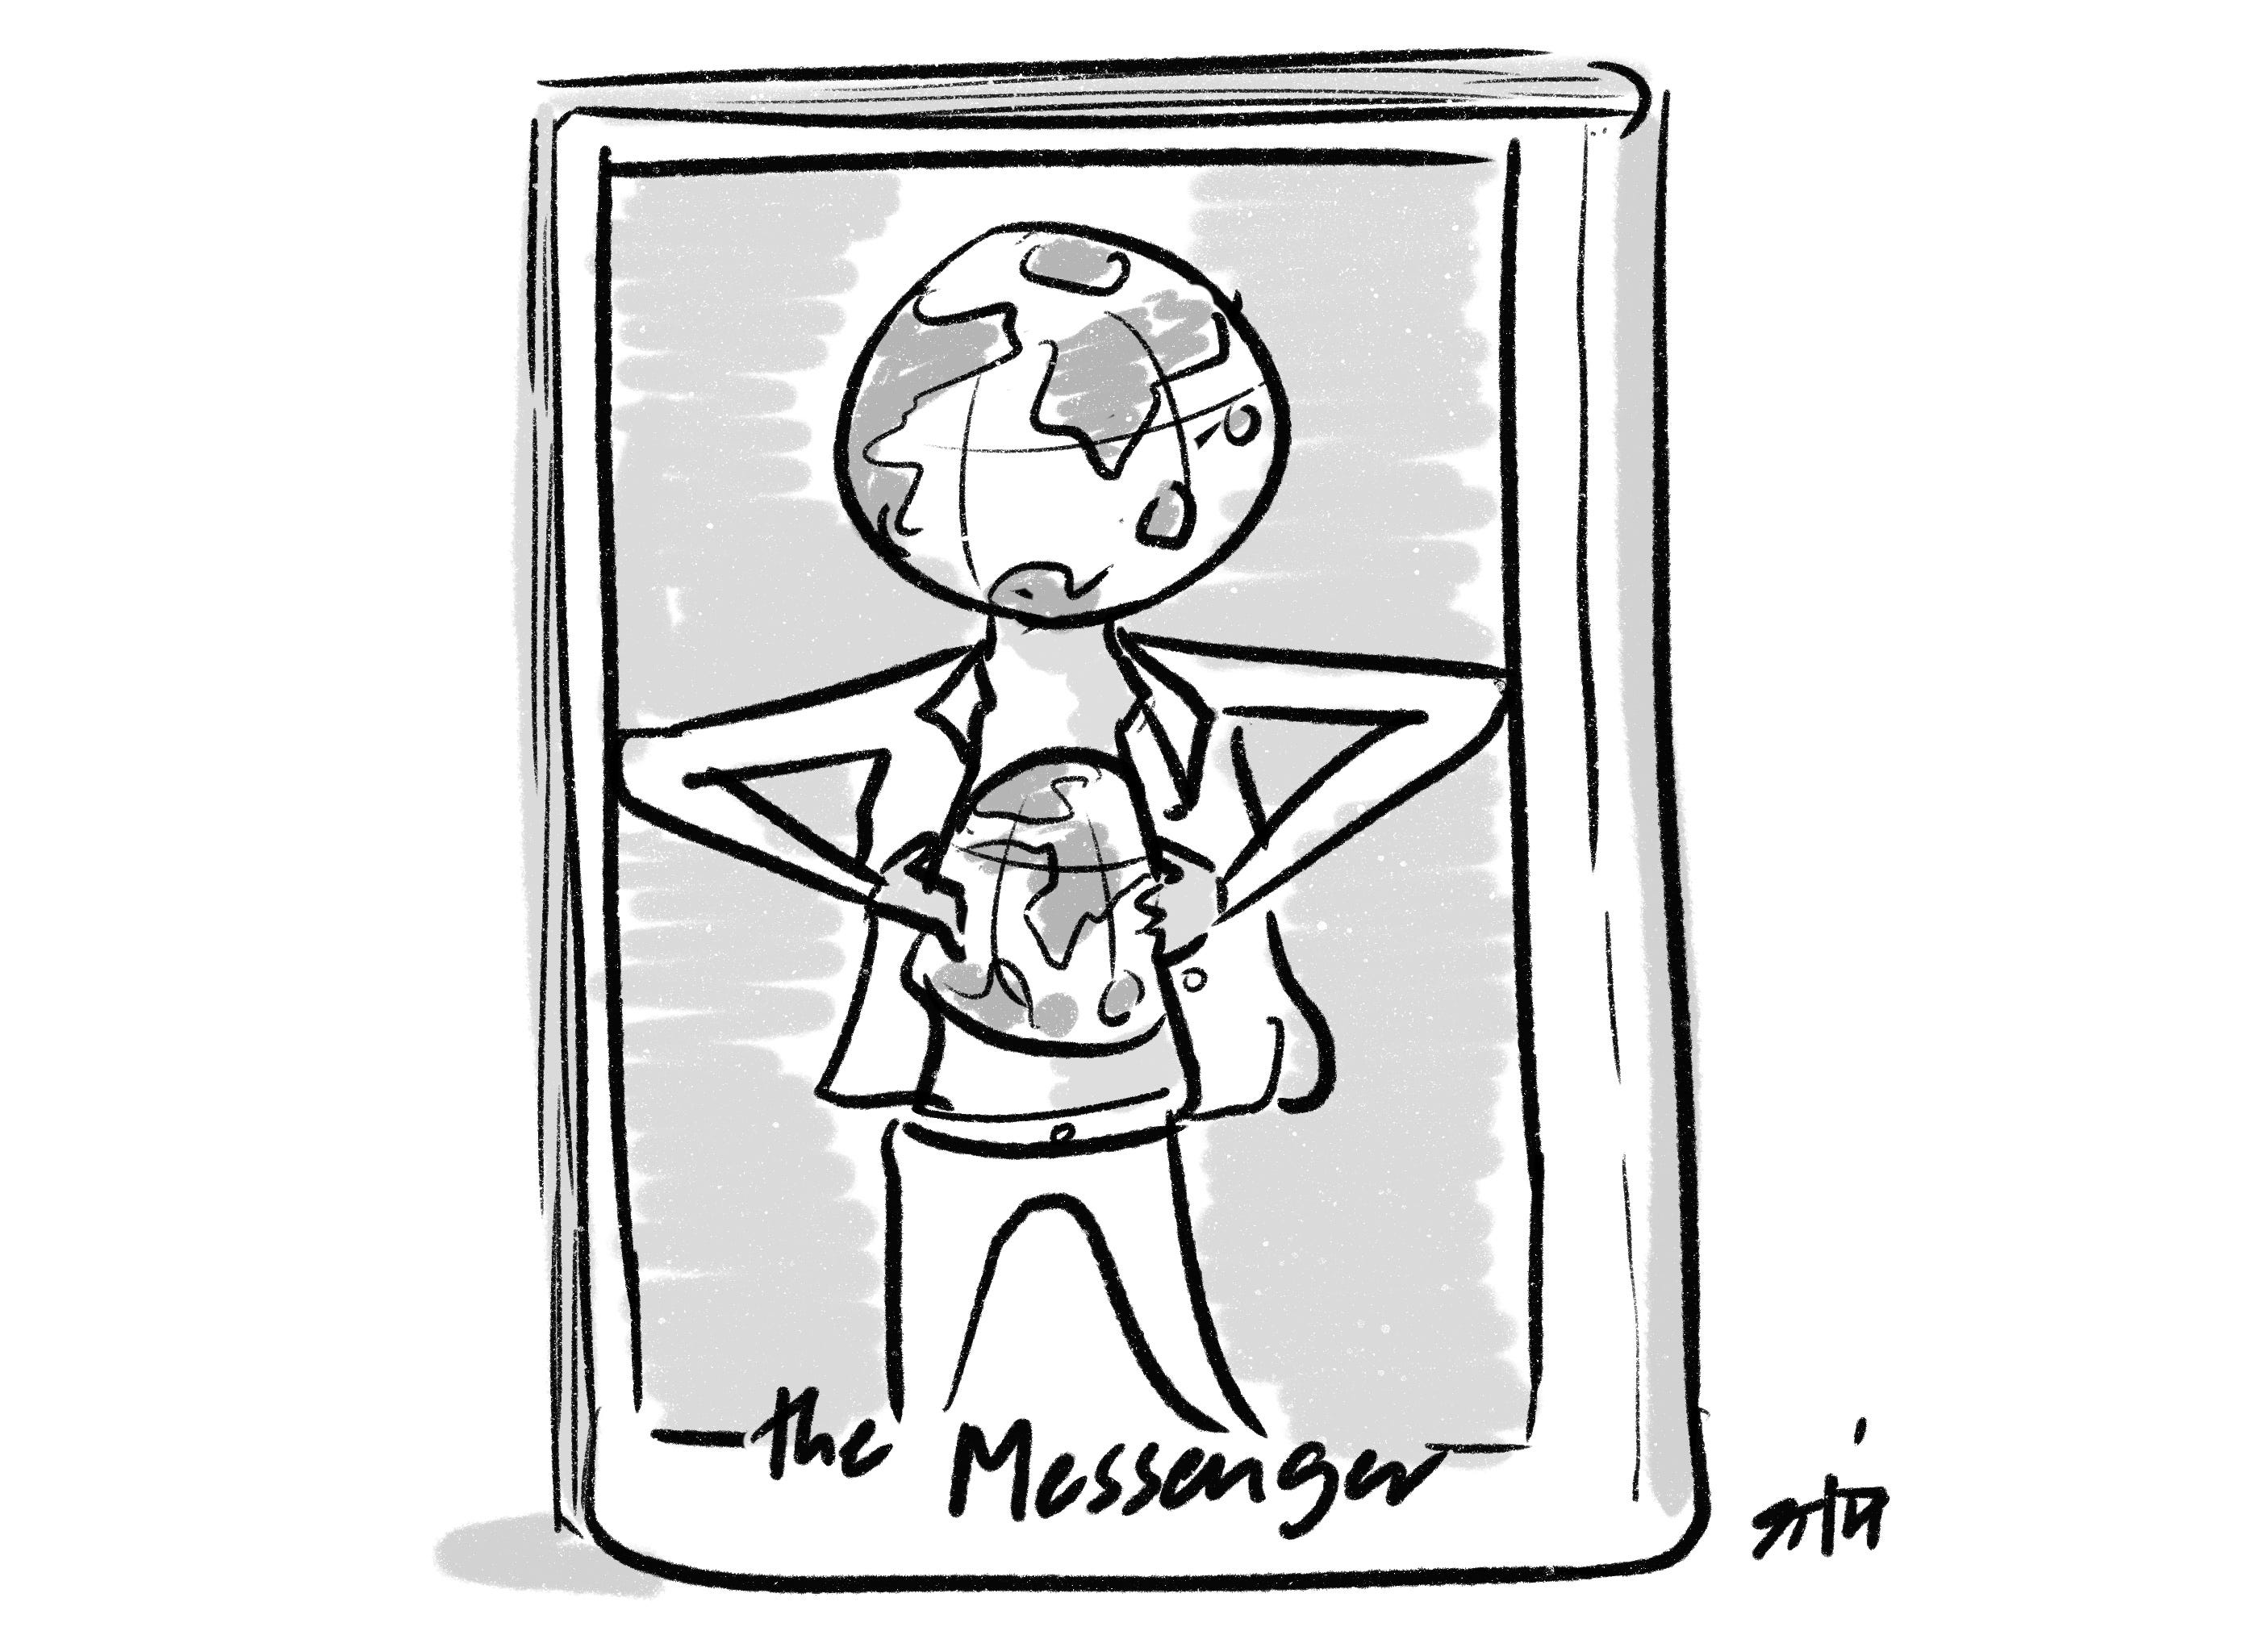
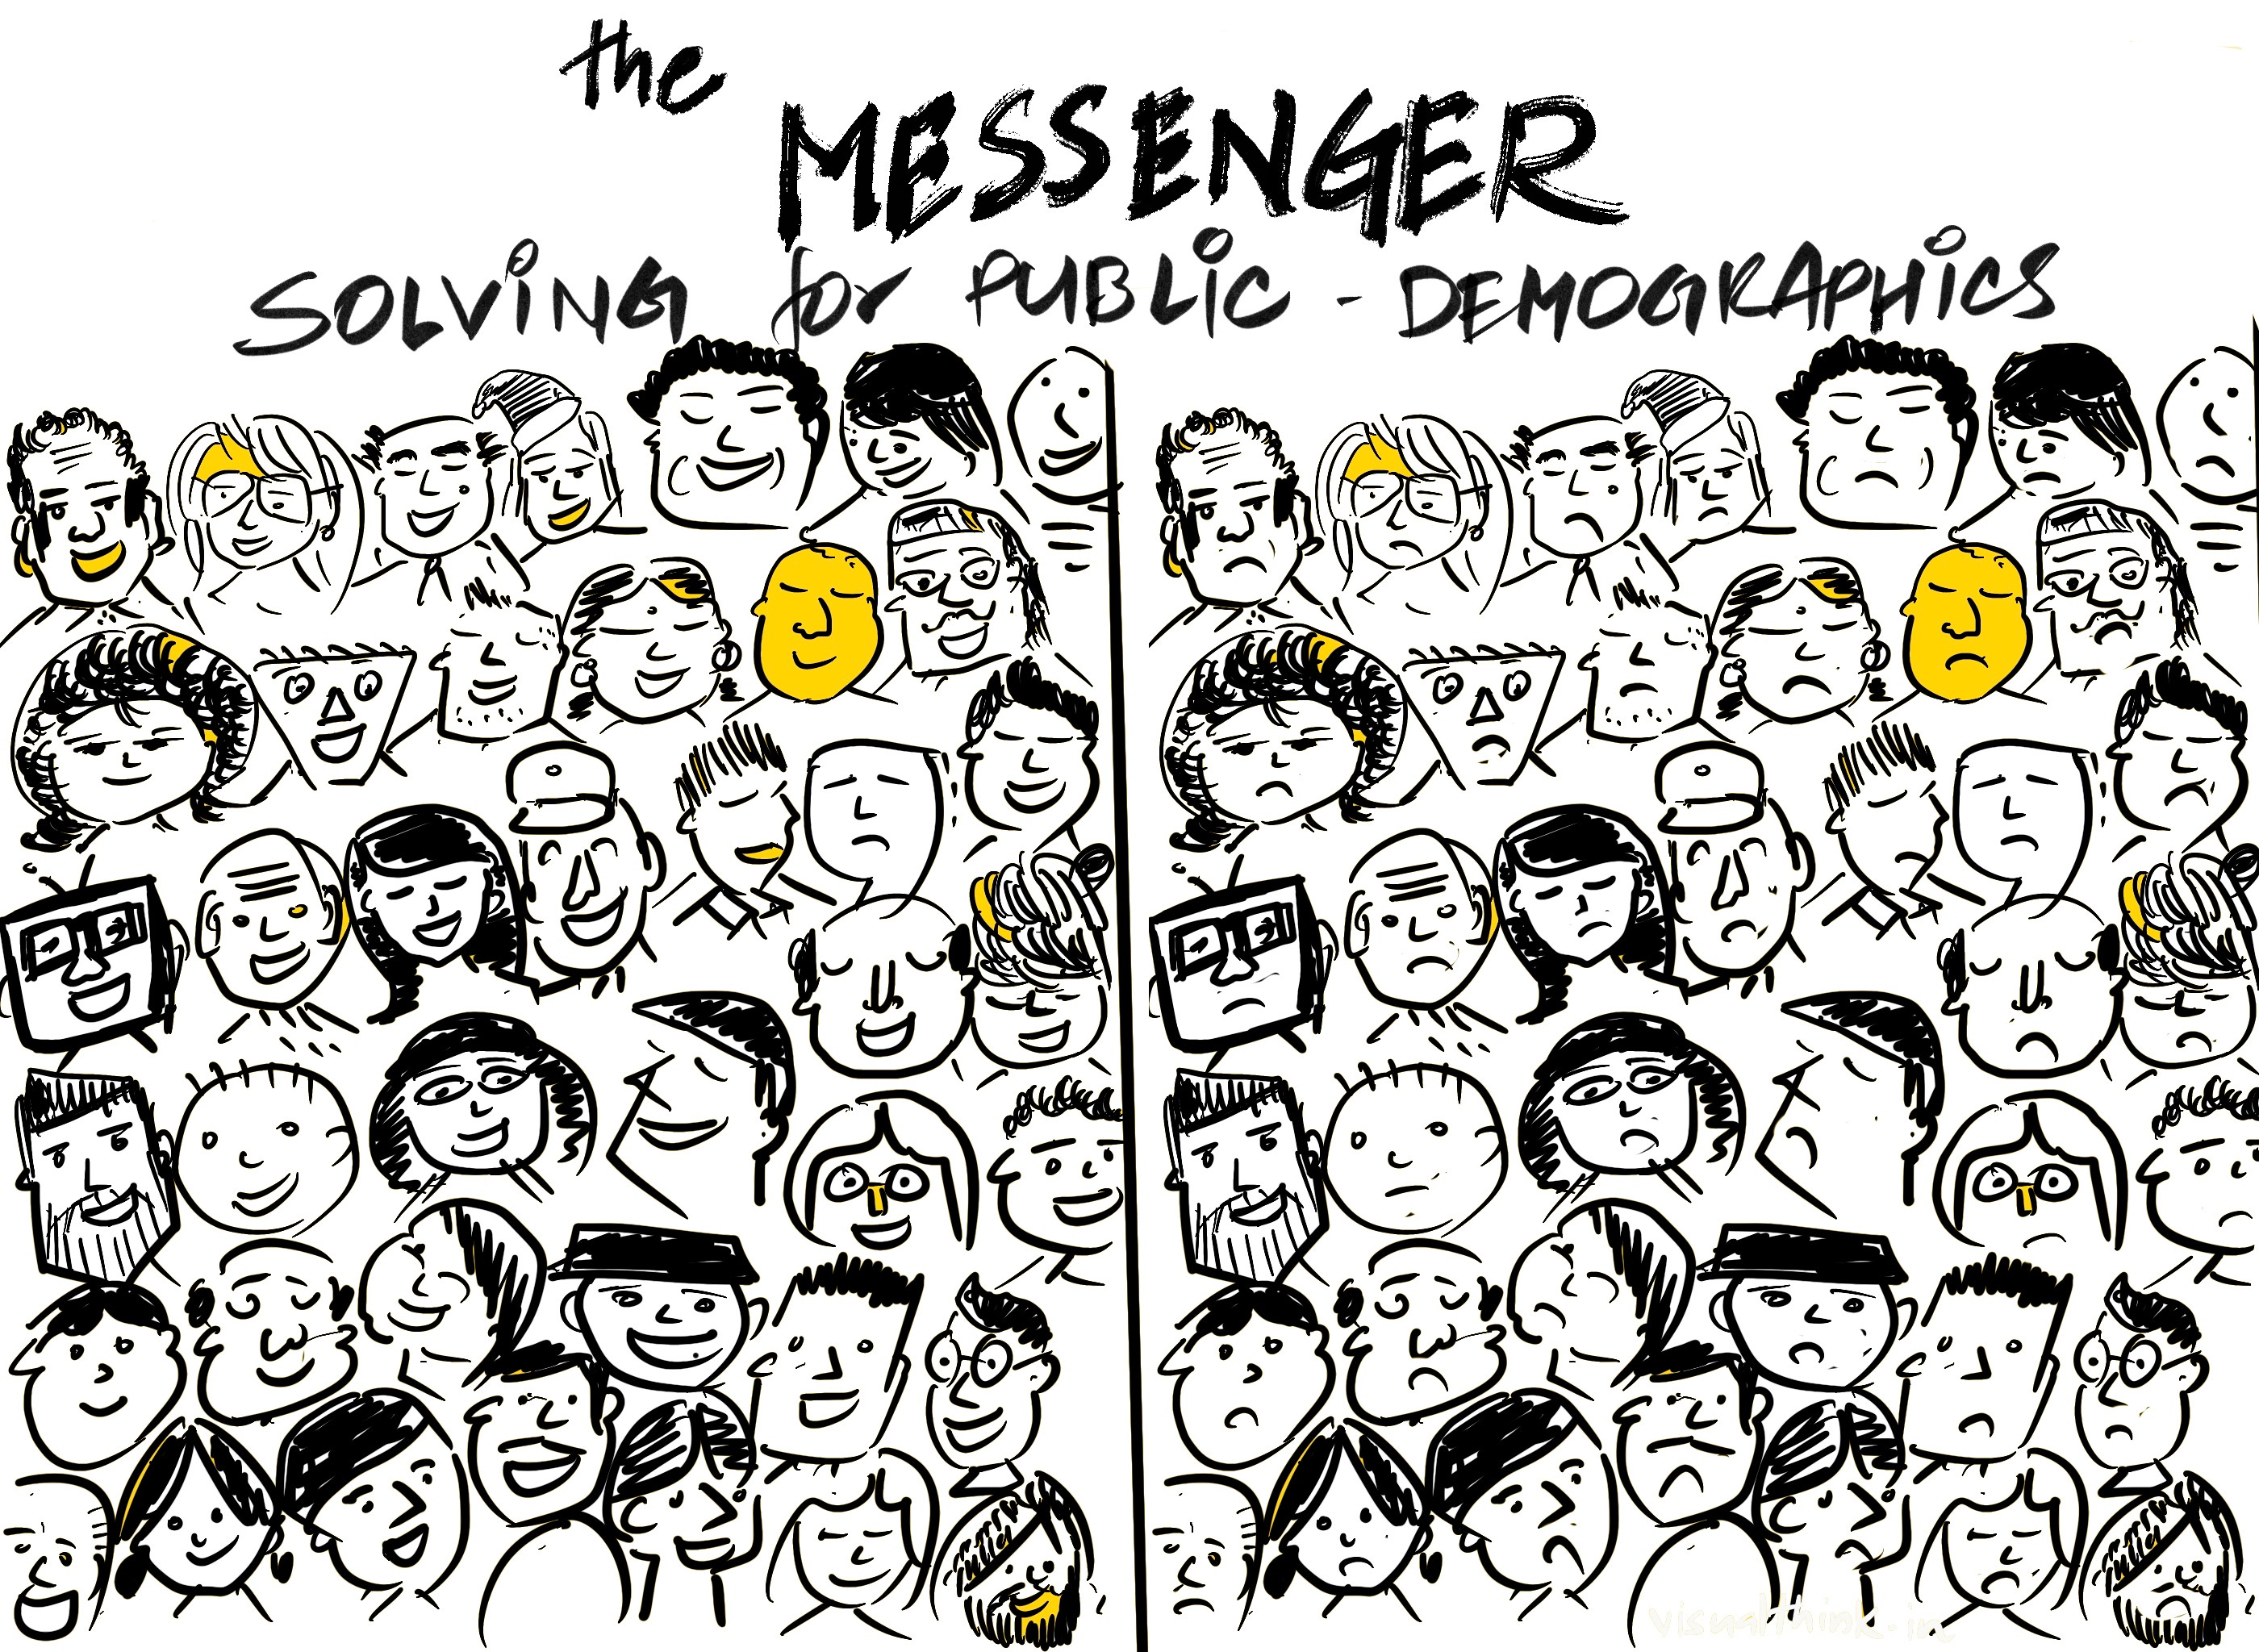
Solving in Public, Part IV: Demographics


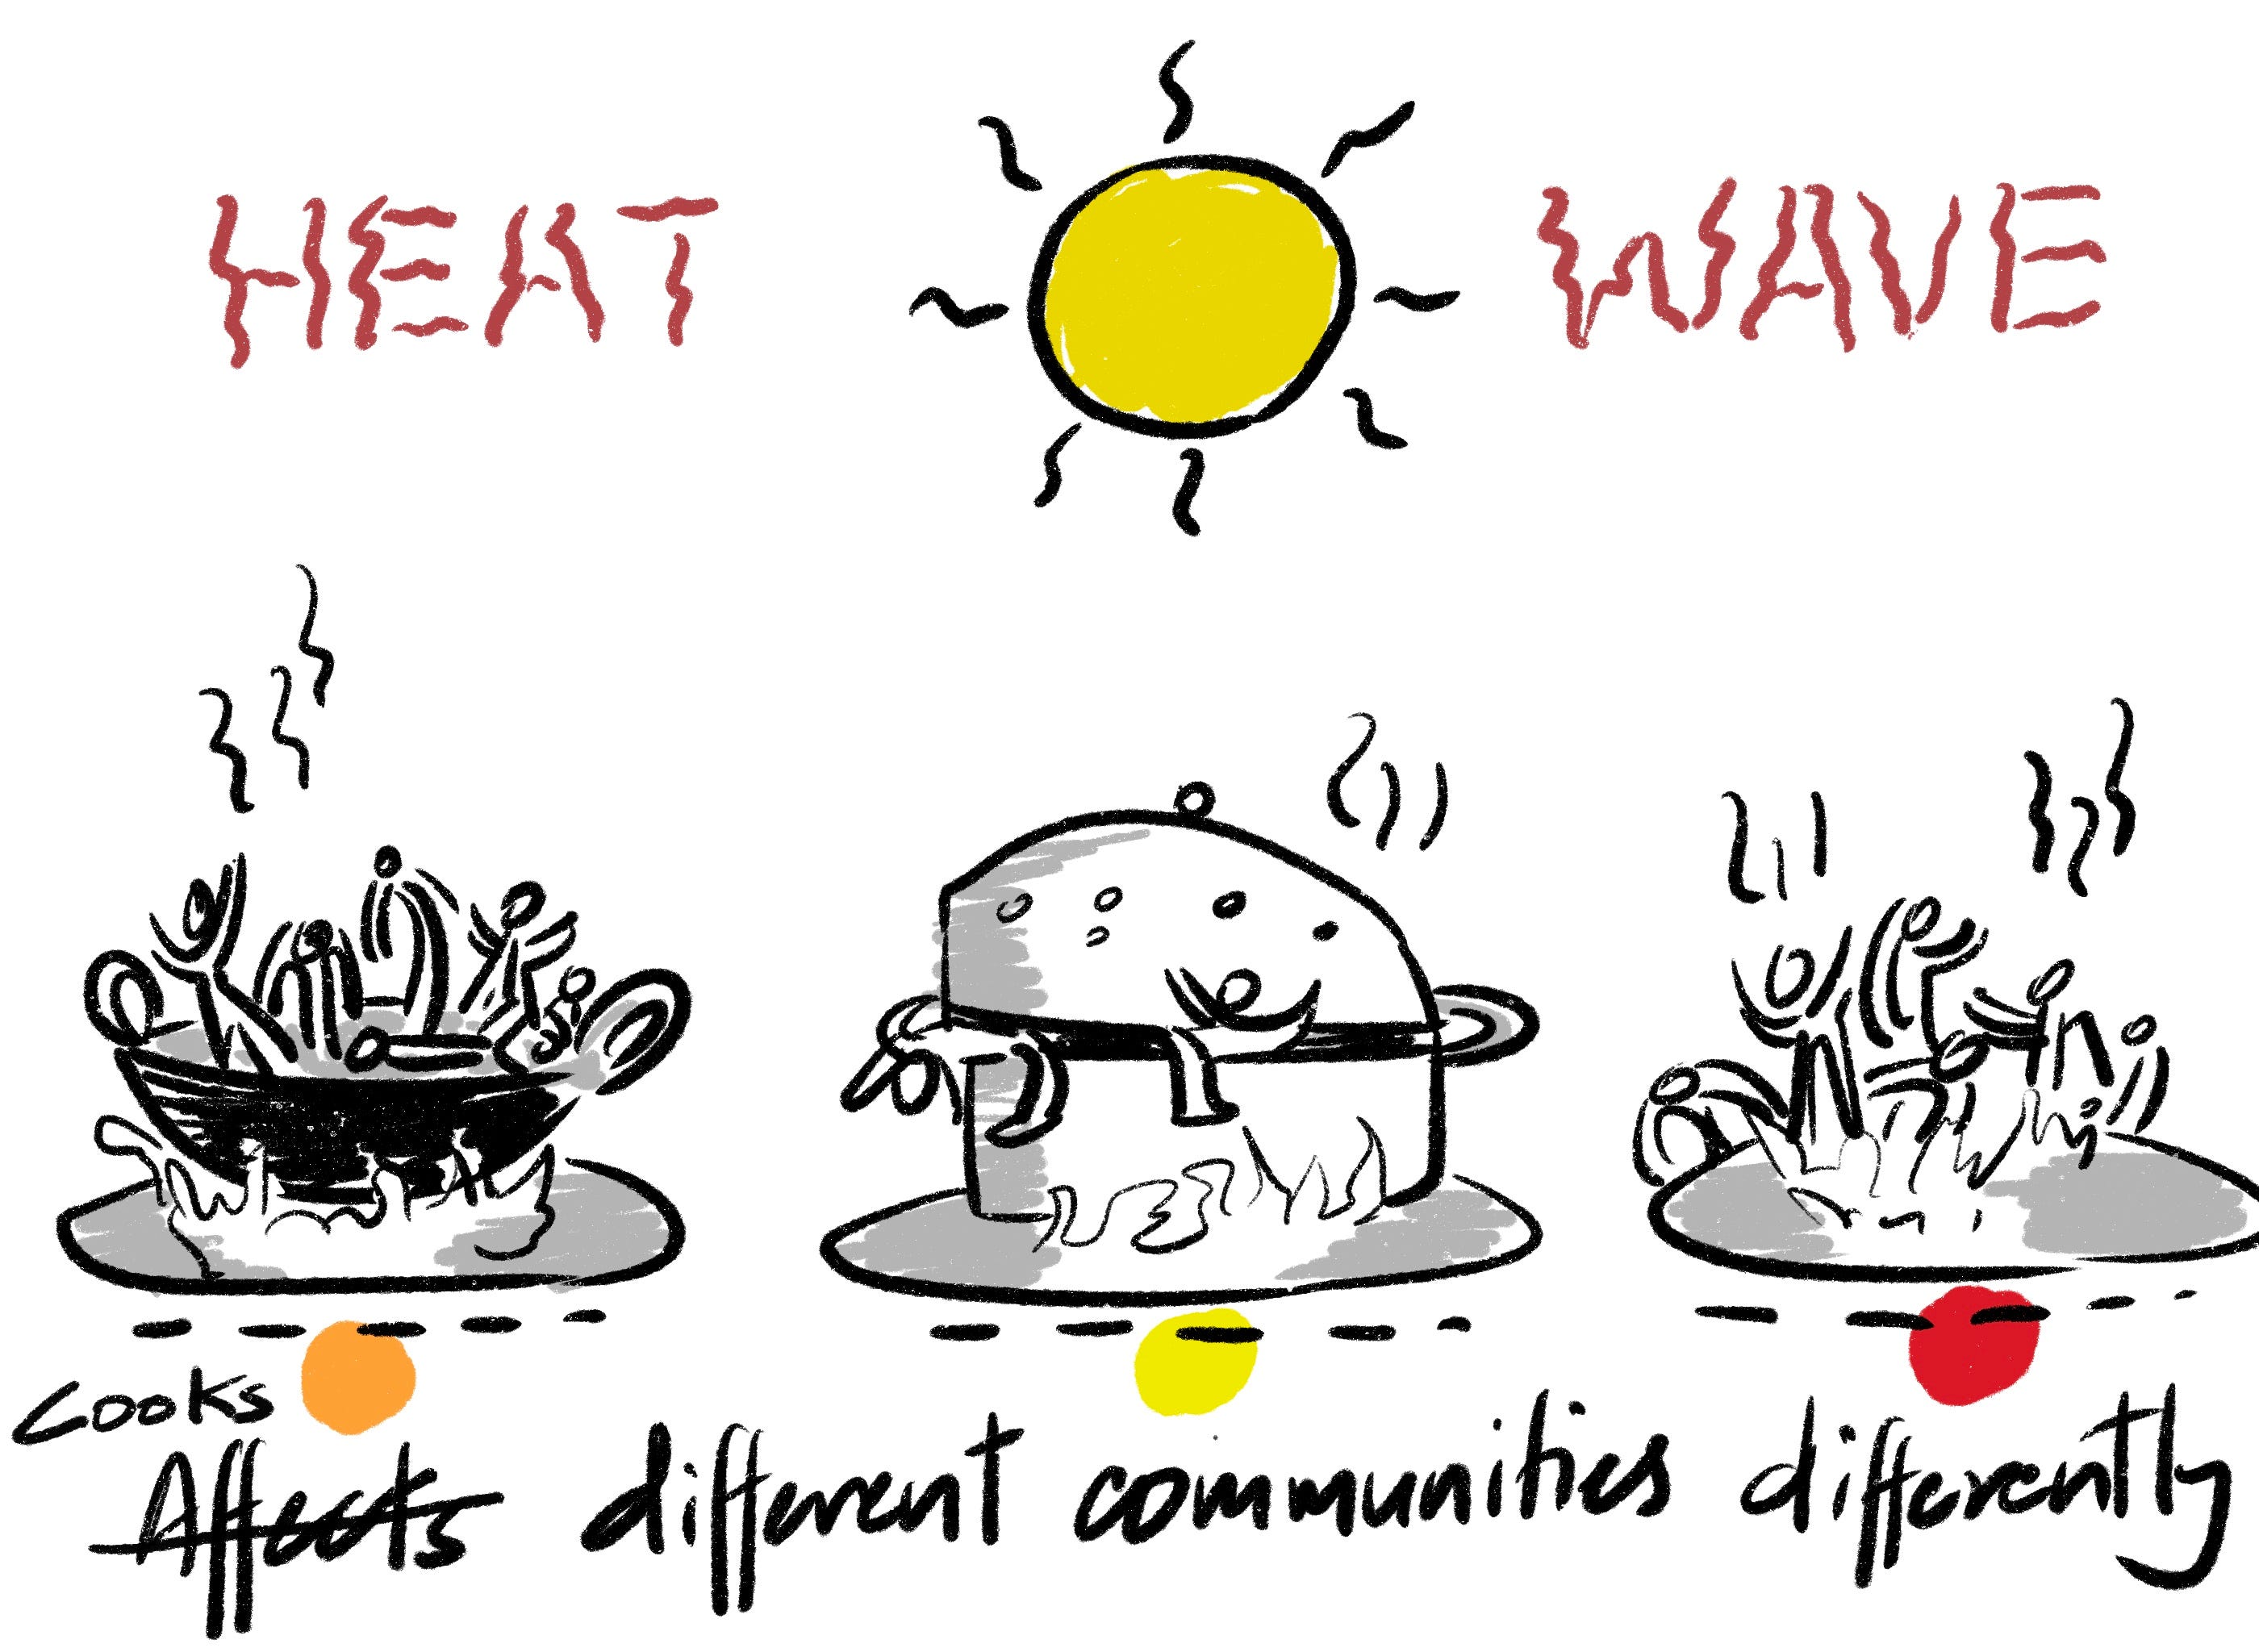
Not everyone experiences a heat wave the same way. There's the obvious difference between experiencing 45 degree weather while sitting inside an air-conditioned room (is it even 45 degree weather then?) and experiencing the same heat while labouring outside in the sun. But that's too crude a difference.
What about catching a DTC bus in the noonday sun if you're a) an eight year old child returning home from school b) an elderly grandmother or c) a bus conductor. All three have different needs. The bus conductor might have the body most suited to that heat, but they are also out in the heat all day long. The grandmother might be the most vulnerable, especially if they have comorbidities, but so could a child who is dehydrated from not drinking water at school.
Actually, the nuances don't stop there. The very same person doing the very same job might experience the noonday sun differently in an industrial area such as Mayapuri (where heat island effects might be greater) than next door in Rajouri Garden. The heat action plan (HAP) doesn't take these demographic and geographic nuances into account, but we were wondering if we could add some nuance ourselves by looking at the demographics of the city.
The next section is a bit technical and you can ignore it if you so desire.
Getting the Data
We are leaning heavily on the 2011 census:
Three datasets downloaded from the website of Census of India:
Census table B01: Main workers, Marginal workers and Non-workers (total)
Census table B04: Main workers (i.e., workers who have been employed for 6 months or more)
Census table B06: Marginal workers (i.e., workers who have been employed for less than 6 months)
One important thing to note is that the B01 table also reports Total Population figure of 1,67,87,941, which should equal the sum of Main Workers, Marginal Workers and Non Workers.
This expectation holds if we only use the data in the B01 table
However, the total number of Main and Marginal Workers reported in B01 do not match that reported in tables B04 or B06, the latter two reporting higher totals
This causes small discrepancies. For instance, when we sum up total number of Main Workers from B04, Marginal Workers from B06 and Non Workers from B01, we end up with a total population of 1,67,90,207 (a 0.01% increase)
Each of these datasets provide counts of workers by District (Code and Name), District Type (Rural/Urban), Age and Gender
Each district had a unique name and a corresponding code, which we verified later (see code further below) to be a unique corresponding code
Additionally, the Main workers and Marginal workers datasets offer counts of workers by Job Type
How to download the data?
Go to https://censusindia.gov.in/census.website/data/census-tables
Select the latest Census year (e.g., 2011)
Select the Table series “Workers”
In the large search bar on the top half of the screen, search for “delhi” or “Delhi”
Pick up the appropriate dataset (use judgement) and download it as an Excel spreadsheet
You can see more details of our analysis by clicking on the link below:
How does analysis of demographics help nuance the HAP?
The HAP is a response to public health needs in the face of extreme heat. We sought reliable data to understand the demographic profile of the state of Delhi. However, the most recent census of India was conducted 13 years ago, in 2011. No other similarly reliable studies were conducted more recently (COVID-19 might have been a hindrance?). We are, therefore, forced to use the 2011 census to make our case. Delhi had about 16.7 million residents in the 2011 census, but depending on whom you believe, it might have as many as 33.5 million now, and the NCR (which will likely have similar heat indices and perhaps the same livelihood distributions) will have a substantially larger population. For our purposes, we could just extrapolate linearly based on the 2011 numbers.
Another challenge we encountered was the unavailability of disaggregated, granular data which are essential to understand the number of different kinds of parties exposed to the sun during heat wave days. For instance, the census of India lumps up Non-Household Manufacturing workers together in one category, but whereas textile producers will likely have less exposure to heat, those involved in manufacturing of glass slabs will have high exposure to heat, which compounds the severe health, personal, financial and social issues they face due to heat waves. Furthermore, the unavailability of disaggregated data prevents us from distinguishing between predominantly office workers, such as managers, and frontline workers, who likely experience heat and/or the sun much more frequently.
The first thing to note is that 2/3rds of Delhi residents don’t work, at least if you believe the 2011 census. In contrast, NY City’s labour force participation rate is 62.4%, a full 30% higher than Delhi. Not totally surprising since the LFPR for women in Delhi is 9.4% (contrast it with the All India figure of ~ 24%). We can speculate on why Delhi has so few working women, but for heat planning purposes, the skewed nature of the LFPR suggests we may have to segment heat action plans for workers and non-workers quite differently. Workers in high-heat vulnerable jobs are likely to be men, while the non-worker category might include several vulnerable populations such as the elderly, young children and pregnant women.
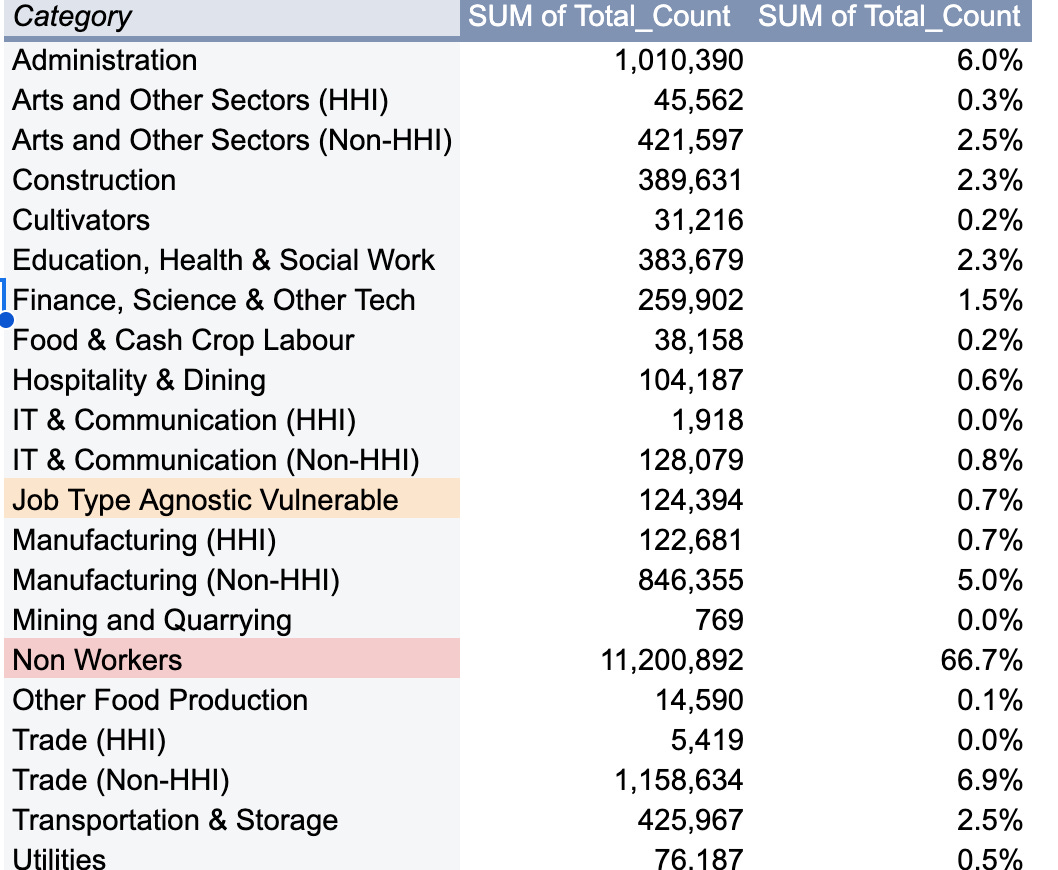
Among the workers, the breakdown by profession is as follows:


There are some clearly high-heat vulnerable populations such as construction workers and transportation workers; we took the liberty of adding our subjective assessment of professions as low, medium and high heat exposure level. A little under 1/5th of all workers have high heat exposure and need special protections.
Almost a million people are highly vulnerable to heat emergencies at work, even in the 2011 census. That’s a lot of people and a lot of resources in the making.
To give just one figure, let’s say we need one heat shelter/1000 vulnerable workers (very conservative), we will still need to build a 1000 shelters. Add to that the supplies such as water and medical equipment and we are talking about a major operation.
We will talk about our recommendations for these worker classes in the next issue, but let’s end this essay with a black box surrounding the biggest chunk of Delhi residents: the non-workers. How do we design effective heat adaptation solutions for them? How many school children are there and how are they distributed across the city? We must of course make sure they don’t collapse from heat as they go to school and back, but that problem is swamped by a much larger problem: extreme heat has a huge impact on learning outcomes and our cognitive capacities. How do we make sure children stay on track?